Loading article...

An empirical thesis and professional guide on becoming a token analyst, auditing tokenomics architectures, calculating fully diluted valuation overhangs, analyzing value capture sinks, and mapping on-chain liquidity distributions.
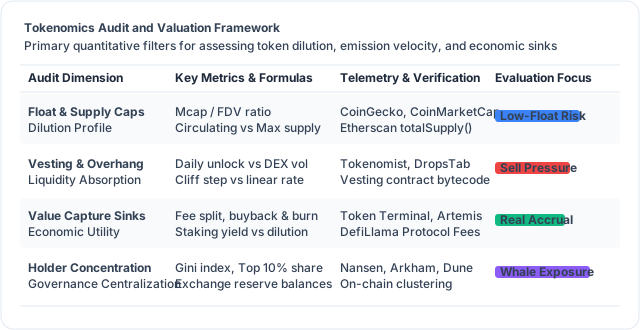
Evaluating digital assets as economic instruments requires an analytical discipline distinct from speculative chart technical analysis or traditional corporate security evaluation. In equity markets, shares represent direct legal ownership of enterprise assets, cash flows, and voting rights enforced through company law and securities regulators. In decentralized networks, cryptographic tokens represent programmable economic primitives. A token can operate simultaneously as a network access key, a governance ballot, a collateral asset, a work coordinator, or a fee distribution mechanism.
However, poorly structured token designs routinely conceal severe structural flaws. Many protocols launch with artificially low circulating supplies, massive venture capital vesting cliffs, hyperinflationary staking rewards, and zero functional value accrual. When large token unlocks occur, the lack of authentic buyer demand results in catastrophic market drawdowns. A professional token analyst audits these tokenomics architectures, builds empirical supply and demand models, evaluates on-chain holder concentration, and stress tests liquidity depth for crypto funds, market makers, protocol treasuries, and institutional allocators.
According to market telemetry compiled by TokenUnlocks and Binance Research, hundreds of projects launched between 2022 and 2025 with low-float, high-FDV structures, resulting in over tens of billions of dollars in structural sell pressure hitting secondary markets. Institutional research desks at Delphi Digital, Messari, and The Block Research have consequently established dedicated tokenomics evaluation standards. Becoming a token analyst requires combining financial modeling, on-chain SQL query proficiency, smart contract audit reading, and game-theoretic mechanism design.
A token analyst evaluates a token as a sovereign financial asset. Rather than asking whether the underlying technology is interesting, the analyst answers concrete questions: What gives this token intrinsic value? Who owns the current supply? When will new supply enter circulation? Will the protocol generate sufficient organic cash flow to absorb upcoming token unlocks?
The operational scope of a token analyst encompasses four primary functions:
Supply Schedule and Overhang Modeling: Verifying total, circulating, and maximum supply directly on-chain through block explorers like Etherscan and Solana Explorer, building detailed unlock calendars across team, seed, private, and ecosystem tranches.
Value Capture and Mechanism Design Auditing: Dissecting whether protocol fees accrue to token holders via fee switches, staking cash flows, token buybacks, or governance voting rights, versus being captured entirely by off-chain entities or external liquidity providers.
On-Chain Holder Clustering and Behavioral Profiling: Using forensic data tools like Nansen and Arkham Intelligence to calculate holder concentration metrics (Gini coefficients), smart money accumulations, and exchange reserve shifts.
Relative and Fundamental Valuation: Computing standardized valuation ratios, including Fully Diluted Valuation (FDV) to Market Capitalization (Mcap) ratios, Price-to-Fees (P/F), Price-to-Sales (P/S), and Fee-to-Emission yields using data aggregators like Token Terminal and Artemis Analytics.
Token analysts work across crypto venture funds such as Pantera Capital, Galaxy Digital, and Framework Ventures, institutional trading desks, research publishers like Bankless, and decentralized autonomous organizations managing multi-million-dollar native token treasuries.
The foundational task of tokenomics auditing is establishing ground truth regarding supply. Aggregator platforms like CoinGecko and CoinMarketCap rely primarily on self-reported project figures, which frequently omit unvested foundation allocations or liquid multisig reserves. A token analyst verifies balances directly from contract bytecode.
Under the ERC-20 Specification, calling the public totalSupply() view function yields the exact minted token count. However, determining true circulating supply requires identifying and subtracting tokens locked in vesting contracts, timelocks, protocol treasuries, and non-circulating multisig vaults.
One of the most damaging market dynamics observed across recent market cycles is the low-float, high-FDV trap. A project launches with only 5 to 10 percent of its total token supply circulating in public markets, while assigning a massive Fully Diluted Valuation of five to ten billion dollars.
With minimal liquid float available for trading, thin order books allow market makers to support elevated spot prices. However, as private investor and team tokens unlock over subsequent quarters, the required capital inflow to maintain existing prices exceeds total secondary market liquidity.
The critical metric monitored by token analysts is the Market Cap to FDV ratio ($Mcap / FDV$):
$$ ext{Float Ratio} = \frac{\text{Circulating Market Capitalization}}{\text{Fully Diluted Valuation}}$$
A float ratio below 0.15 indicates severe future dilution risk. If a token possesses an Mcap of $300 million and an FDV of $3 billion, ninety percent of total supply remains unreleased. Unless protocol adoption and fee generation grow tenfold before cliff releases, sustained downward price pressure is mathematically inevitable.
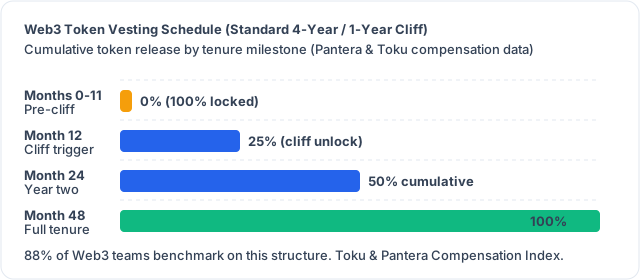 Figure 2: Architectural progression of token vesting cliffs, linear unlocks, and secondary market supply expansion curves.
Vesting schedules govern the timeline under which restricted tokens become liquid. An analyst never relies on decorative marketing pie charts. They read and audit the deployed smart contracts that enforce token distribution.
In production environments, teams employ audited vesting contracts such as OpenZeppelin VestingWallet or custom linear streaming contracts. Key parameters verified by the analyst include:
Cliff Duration: The initial period during which zero tokens are released. Standard institutional norms feature a 12-month cliff for core contributors and 6 to 12 months for seed investors.
Vesting Duration and Cadence: The release period following the cliff, typically spanning 24 to 48 months. Linear per-second streaming contracts such as Sablier or LlamaPay distribute selling pressure evenly, whereas monthly or quarterly step-unlocks create discrete liquidity shocks.
Transferability of Unvested Rights: A critical legal and architectural nuance. Certain token contracts allow beneficiaries to transfer ownership of their vesting beneficiary address. This permits private investors to sell forward token claims to secondary buyers via over-the-counter (OTC) agreements, transferring downward pressure into the market long before the official unlock date.
import pandas as pd
import numpy as np

def calculate_monthly_overhang(total_supply, unlock_schedule, current_dex_volume):
    """
    Computes monthly unlock volume as a percentage of daily trading liquidity.
    """
    df = pd.DataFrame(unlock_schedule)
    df['unlock_token_volume'] = df['pct_unlocked'] * total_supply
    df['daily_unlock_run_rate'] = df['unlock_token_volume'] / 30.0
    df['liquidity_absorption_ratio'] = df['daily_unlock_run_rate'] / current_dex_volume

    # Overhang > 5% of daily volume signals severe price impact
    df['market_stress_flag'] = df['liquidity_absorption_ratio'] > 0.05
    return df
Analysts benchmark upcoming unlock volumes against real spot market liquidity. If an upcoming monthly unlock represents more than five percent of thirty-day average daily trading volume recorded on DefiLlama or GeckoTerminal, the market will face severe absorption friction.
Token utility defines the economic relationship between protocol usage and token demand. Without structural token sinks, a token functions merely as a speculative meme coin or a non-binding governance token.
A token analyst evaluates value capture mechanisms across five established archetypes:
Protocols like Uniswap Labs, Aave Governance, and MakerDAO / Sky generate hundreds of millions of dollars in gross annual fees. The primary mechanism for direct value capture is the protocol fee switch. When activated by token governance, a fraction of system fees is routed directly to token holders or used by the treasury to execute programmatic buyback-and-burn operations.
Analysts evaluate the legal and regulatory constraints surrounding fee distributions, modeling the Price-to-Earnings equivalent ($P/E$) of protocols using standardized cash flow data from Token Terminal.
In decentralized service networks, including decentralized physical infrastructure (DePIN) and oracle networks like Chainlink Documentation, node operators must stake native tokens as economic collateral to earn the right to provide services and earn fees. If a node operator acts maliciously or experiences server downtime, their staked tokens are slashed. This locks significant supply off the market in direct proportion to network demand.
Pioneered by Curve Finance and adopted by protocols across decentralized finance, the vote-escrow model requires users to lock native tokens for periods ranging from one week up to four years in exchange for non-transferable veTokens. In return, lockers gain proportional governance voting power to direct weekly liquidity emissions, boosted staking yields, and a share of protocol fees.
Analysts model veToken locking velocity to measure circulating float reduction. If locking demand declines, secondary token demand drops precipitously.
Many projects mask a lack of utility by offering thirty percent staking rewards. However, if staking rewards are paid entirely in newly minted native tokens without corresponding fee revenue, the staking program is simply dilution. The token analyst calculates the Fee-to-Emission Ratio:
$$ ext{Fee-to-Emission Ratio} = \frac{\text{Annual Protocol Fee Revenue}}{\text{Annual Value of Newly Minted Incentive Tokens}}$$
A ratio below 1.0 indicates that the protocol pays out more in dilution incentives than it generates in organic economic revenue, rendering the yield unsustainable.
A specialized area of token analysis involves evaluating synthetic assets, algorithmic mechanisms, and multi-token gaming economies. Historical design failures provide critical lessons in mechanism vulnerability:
Modern token analysts closely scrutinize synthetic dollar models like USDe by Ethena Labs. Unlike fiat-backed stablecoins (USDC or USDT) holding short-term US Treasury bills, synthetic dollars maintain their peg through automated cash-and-carry basis trades: holding spot crypto assets (stETH or BTC) while establishing equivalent short perpetual futures positions on centralized derivative exchanges.
The analyst models basis yield sustainability against negative funding rate periods. If perpetual funding rates remain persistently negative during extended bear markets, the short position incurs carry costs rather than generating yield, forcing the protocol to tap emergency insurance funds. Analysts audit these reserve fund sizes, custodian counterparty risks (off-exchange settlement via Copper or Fireblocks), and redemption queue latencies.
In gaming and social tokens, dual-token designs were widely adopted: a primary governance token with capped supply (such as AXS or GMT) paired with an uncapped, inflationary utility token (such as SLP or GST) awarded to players for in-game activities.
Without strict sink mechanisms, utility token supply expands exponentially. As newly onboarded player growth slows, daily token minting from existing players vastly exceeds token burn for in-game upgrades, resulting in hyperinflationary price collapses. A token analyst builds dynamic system models in Python or Stella to simulate user growth inflection points, mapping the exact ratio of active players to daily token burn required to maintain economic equilibrium.
Similarly, examining the historical collapse of algorithmic stablecoins like Terra Luna demonstrates the hazards of endogenous collateral backing. When the collateral asset backing a stablecoin is the protocol's own speculative governance token, a confidence shock creates a reflexive death spiral: redemptions expand governance token supply, driving prices downward and triggering further panic redemptions. Modern institutional designs, such as the transition by Frax Finance to one hundred percent exogenous collateralization, reflect this hard-earned analytical consensus.
Macro data providers like CoinMetrics, CryptoRank, and Amberdata allow analysts to run historical liquidity simulations, stress-testing whether collateral vaults can withstand three-standard-deviation market drawdowns without triggering protocol insolvency.
Transparent public ledgers allow token analysts to examine holder distribution with granularity unavailable in traditional equity markets. Using SQL on Dune Analytics, Flipside Crypto, and Footprint Analytics, analysts track address clustering, wallet categorization, and capital movements.
Key concentration metrics evaluated include:
Gini Coefficient of Token Wealth: A statistical measure between 0 and 1 measuring wealth inequality across token holders. A Gini score exceeding 0.85 indicates extreme centralization, meaning a handful of whale addresses dictate market liquidity.
Top 10 / Top 50 Holder Concentration: The percentage of circulating tokens held by the top non-contract addresses. If insiders, seed funds, or early team members control sixty percent of liquid tokens, any portfolio allocation carries immense liquidation risk.
Centralized Exchange (CEX) Net Flows: Monitoring net inflows and outflows across exchange deposit addresses using data from Nansen and Glassnode. Persistent spikes in exchange deposit volumes typically precede major market selling events.
Smart Money Accumulation: Tracking address clusters labeled as high-performing funds, institutional custodians, or experienced DeFi exploiters using Arkham Intelligence.
-- Dune SQL: Calculating Top 20 Non-Contract Holder Concentration
WITH address_balances AS (
    SELECT
        address,
        balance / 1e18 AS token_balance
    FROM erc20_ethereum.balances
    WHERE contract_address = 0x7Fc66500c84A76Ad7e9c93437bFc5Ac33E2DDaE9 -- AAVE
      AND address NOT IN (
          SELECT address FROM ethereum.contracts
      )
    ORDER BY balance DESC
    LIMIT 20
)
SELECT
    SUM(token_balance) AS top_20_tokens_held,
    (SUM(token_balance) / 16000000.0) * 100 AS top_20_pct_of_supply
FROM address_balances;
Validating queries against contract state through Etherscan ensures that multi-sig treasury contracts, bridge escrows, and burn addresses are properly excluded from individual whale concentration calculations.
While early crypto assets were valued purely on speculative narratives, institutional asset managers employ fundamental and relative valuation frameworks:
Price-to-Fees (P/F) Ratio: The ratio of fully diluted valuation to annualized protocol fees. Similar to Price-to-Sales in SaaS businesses, P/F evaluates the premium investors pay per dollar of gross economic activity generated by the protocol.
Price-to-Earnings (P/E) Ratio: The ratio of market capitalization to net protocol revenue retained by the treasury or distributed to token holders after paying liquidity provider incentives.
Network Value to Transactions (NVT) Ratio: Evaluates network valuation relative to daily transaction throughput on base-layer blockchains like Ethereum or Solana, indicating whether market capitalization outpaces on-chain settlement activity.
Token Liquidity Depth at Slippage: Measuring the exact USD capital required to move spot token prices by two percent (+/- 2%) across decentralized and centralized order books using data from Kaiko and Parsec Finance. A protocol with a five-billion-dollar FDV but only $200,000 in two-percent liquidity depth is structurally fragile.
Macro research reports from Delphi Digital and Messari benchmark these ratios across competitive sectors, comparing decentralized exchanges like Uniswap, Curve Finance, and Hyperliquid against decentralized lending markets like Aave, Compound Finance, and Morpho Protocol.
The demand for rigorous token analysts has accelerated as institutional allocators, token advisory firms, and protocol DAOs face stricter risk management mandates. According to compensation data from Pantera Capital and Web3.career:
Entry-level token analysts with solid quantitative modeling, Excel mastery, and public research writeups earn between $85,000 and $120,000 USD. Experienced mid-level tokenomics analysts with proven on-chain SQL query skills and protocol advisory experience command $125,000 to $175,000 USD. Senior token designers and head of tokenomics leads at premier venture funds earn from $180,000 to $275,000 USD, often supplemented with fund carry, token performance incentives, or advisory retainers.
To establish credibility and secure high-tier analyst positions, candidates should build a transparent portfolio:
Publish Comprehensive Token Audits: Produce detailed tokenomics teardowns covering supply distribution, vesting schedules, and value capture models for newly launched protocols, publishing reproducible spreadsheets and unlock charts.
Deploy Public Dune Analytics Dashboards: Create interactive dashboards tracking circulating supply reconciliation, holder Gini coefficients, and real yield metrics for prominent protocols.
Formulate Governance Proposals: Write well-reasoned token parameter adjustment proposals on protocol governance forums such as the Uniswap Foundation forum and the Aave Governance forum, such as adjusting fee split ratios on Aave or emissions schedules on Curve.
Analyze Historical Failures: Document detailed post-mortem case studies examining why past algorithmic stablecoins, hyperinflationary GameFi tokens, or low-float launches experienced structural collapses.
By developing deep competency in smart contract verification, rigorous quantitative modeling, and adversarial mechanism design, token analysts provide the empirical clarity needed to allocate capital safely across the evolving decentralized economy.