Loading article...

An empirical thesis and career guide on becoming a decentralized finance analyst, exploring quantitative on-chain metrics, economic risk modeling, protocol solvency, and market compensation bands.
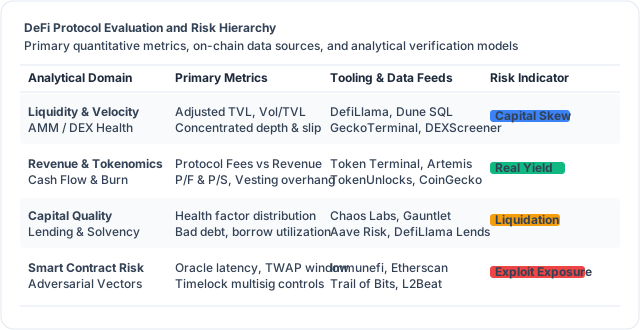
Evaluating decentralized financial protocols requires an analytical paradigm distinct from traditional equity research or credit analysis. In corporate finance, analysts rely on quarterly financial statements audited by accounting firms, management guidance conferences, and opaque regulatory filings. In decentralized finance (DeFi), every balance update, liquidity deposit, liquidation event, and fee distribution is publicly recorded on an immutable ledger in real time.
However, transparency does not equal simplicity. Raw on-chain data is noisy, convoluted by flash loans, circular token incentives, synthetic liquidity wash trading, and uncollateralized exposure. A DeFi analyst translates distributed ledger events into rigorous quantitative models, solvency stress tests, and capital allocation recommendations for venture funds, market makers, protocol DAOs, and risk modeling firms.
According to market data aggregators like DefiLlama, total value locked across decentralized protocols exceeds eighty billion dollars, with decentralized exchange volumes routinely surpassing three billion dollars daily. Yet navigating this ecosystem demands disciplined due diligence. As demonstrated by historical exploits tracked by Immunefi and CertiK, failure to evaluate economic attack vectors, bad debt accrual, or oracle latency can wipe out millions of dollars in capital within a single block.
A DeFi analyst operates at the intersection of quantitative data science, financial economics, smart contract architecture, and governance mechanics. Unlike speculative commentators, professional analysts produce reproducible research that guides capital deployment and protocol parameters.
The core responsibilities of a professional DeFi analyst encompass four primary domains:
Protocol Due Diligence and Architecture Auditing: Dissecting whitepapers, smart contract repositories, and system parameters to map out capital flow mechanisms, fee splits, token distribution schedules, and multisig governance controls.
On-Chain Data Engineering and SQL Modeling: Writing complex analytical queries across decoded event tables in Dune Analytics, Flipside Crypto, or Footprint Analytics to measure organic protocol adoption, user retention cohorts, and capital velocity.
Economic Risk and Solvency Stress Testing: Modeling loan liquidation thresholds, bad debt accumulation, borrow utilization curves, and liquidity slippage across varying market volatility conditions, collaborating with specialized risk firms like Gauntlet Network and Chaos Labs.
Tokenomics and Valuation Assessment: Evaluating token issuance rates, real yield distributions, protocol revenue vs token inflation, and treasury runway to calculate intrinsic value ratios.
Employers range from crypto-native hedge funds and venture capital firms like Pantera Capital and Delphi Digital to institutional research desks at Messari and The Block Research, decentralized autonomous organizations like MakerDAO / Sky, and automated risk parameter providers.
To separate authentic economic productivity from mercenary liquidity farming, a DeFi analyst tracks standardized metrics across distinct protocol classes:
Total Value Locked (TVL) represents the aggregate USD value of assets deposited into a protocol. However, raw TVL can be highly misleading. Naive TVL metrics often double-count tokens re-hypothecated across nested protocols (such as liquid staking derivatives deposited into lending markets), or inflate numbers by counting a protocol's native unvested governance tokens as collateral.
An experienced analyst evaluates Adjusted TVL, which excludes native governance tokens, discounts re-staked assets, and denominates balances in native crypto units (ETH, BTC, SOL) to distinguish real asset inflows from market price appreciation.
Decentralized protocols generate fees by taking a slice of transactions, swaps, or interest payments. However, fees do not equal protocol revenue:
Total Fees: The gross economic value paid by protocol users. In Uniswap Labs, total swap fees are paid entirely to liquidity providers.
Protocol Revenue: The portion of gross fees retained by the protocol treasury or distributed directly to token holders. Platforms like Token Terminal and Artemis Analytics standardize these figures, allowing analysts to compute traditional valuation multiples including Price-to-Fees (P/F) and Price-to-Sales (P/S).
Supply-Side Revenue: The share of fees allocated to external capital providers, such as liquidity providers in automated market makers or depositors in lending protocols like Aave Governance and Compound Finance.
Many protocols advertise headline Annual Percentage Rates (APR) exceeding twenty or fifty percent. A DeFi analyst decomposes headline yields into two components: Real Yield and Token Emission Yield.
Real yield stems from genuine cash flows generated by protocol usage, distributed in non-inflationary assets like USDC or ETH. Emission yield consists of newly minted native governance tokens distributed as liquidity incentives. If a protocol pays fifteen percent yield in native tokens while diluting supply by thirty percent annually, net investor return is negative. Analysts verify token inflation schedules using data platforms like TokenUnlocks and CoinGecko.
Different decentralized finance primitives require distinct analytical frameworks:
When evaluating automated market makers like Uniswap v3, Curve Finance, and Balancer, analysts examine liquidity concentration, pool depth, and volume-to-TVL velocity. In concentrated liquidity AMMs, capital efficiency is high, but liquidity providers face the risk of impermanent loss (divergence loss) when asset prices drift. Analysts build Python and SQL models to calculate whether trading fee income offsets impermanent loss for active LP cohorts.
Real-time swap data and pool liquidity are monitored using tools like GeckoTerminal, DEXScreener, and Parsec Finance.
In lending markets like Aave v3, Compound, and Morpho Protocol, the fundamental risk is insolvency caused by collateral value drops. Analysts examine Loan-to-Value (LTV) ratios, liquidation thresholds, and borrow utilization rates.
If borrow utilization approaches one hundred percent, liquidity pools become illiquid, preventing depositors from withdrawing funds and causing interest rate curves to spike exponentially. Analysts monitor the liquidation health factor distribution across large borrowing positions to identify liquidation cascades that could result in bad debt for the protocol.
Decentralized perpetual exchanges like Hyperliquid, GMX, and Synthetix generate substantial real cash flow. Key metrics include open interest (OI), long-to-short funding rates, daily trading volume, and liquidity vault performance. Analysts evaluate whether trading vaults (such as GLP or liquidity provider pools) are taking excessive directional exposure against profitable trader cohorts.
Liquid staking providers like Lido Finance and restaking protocols like EigenLayer represent foundational layers of the Web3 economy. In restaking, staked ETH is delegated to secure Actively Validated Services (AVSs), introducing secondary slashing risks. Analysts evaluate validator performance, operator concentration, withdrawal queue latency, and smart contract upgrade delays. Yield decomposition across fixed-income protocols like Pendle Finance allows analysts to track implied yields versus real staking yields.
A critical technical competency for a DeFi analyst is modeling automated market maker dynamics. In constant-product market makers like Uniswap v2, liquidity pools follow the invariant formula $x \cdot y = k$, where $x$ and $y$ denote token reserve balances. When market prices change externally, arbitrageurs trade with the pool until internal relative prices align with the broader market. This process creates impermanent loss (divergence loss) for liquidity providers.
The mathematical formula for impermanent loss as a function of the price ratio $k_p = P_{new} / P_{initial}$ is expressed as:
$$IL = \frac{2 \sqrt{k_p}}{1 + k_p} - 1$$
When an asset price doubles ($k_p = 2$), the impermanent loss is approximately 5.72 percent compared to holding the assets outside the pool. If the price experiences a five-fold increase ($k_p = 5$), impermanent loss expands to 25.46 percent.
In concentrated liquidity AMMs like Uniswap v3, introduced by Uniswap Labs and researched by Paradigm, liquidity providers allocate capital within custom price intervals $[p_a, p_b]$. This boosts capital efficiency by orders of magnitude, but amplifies impermanent loss when the market price breaches the interval bounds.
import numpy as np
import pandas as pd

def calculate_concentrated_il(price_ratio, lower_tick, upper_tick):
    """
    Calculates impermanent loss within concentrated price bounds.
    """
    sqrt_p = np.sqrt(price_ratio)
    sqrt_pa = np.sqrt(lower_tick)
    sqrt_pb = np.sqrt(upper_tick)

    if price_ratio < lower_tick:
        v_lp = sqrt_pa * sqrt_pb * (sqrt_pb - sqrt_pa)
        v_hold = sqrt_pb
    elif price_ratio > upper_tick:
        v_lp = (sqrt_pb - sqrt_pa)
        v_hold = price_ratio * sqrt_pa
    else:
        v_lp = 2 * sqrt_p - sqrt_pa - (price_ratio / sqrt_pb)
        v_hold = price_ratio + 1

    return (v_lp / v_hold) - 1.0

# Evaluate impermanent loss for a 20% range around current price
price_shifts = np.linspace(0.5, 2.0, 100)
losses = [calculate_concentrated_il(p, 0.9, 1.1) for p in price_shifts]
Analysts build automated backtesting scripts using Python and data from Kaiko or Amberdata to assess whether collected swap fees compensate liquidity providers for impermanent loss across historical volatility regimes. This empirical modeling determines where treasury assets should be deployed to earn sustainable protocol yield.
Lending protocol solvency hinges upon effective liquidation mechanisms. In decentralized money markets, loans are overcollateralized. When a borrower's collateral value drops, their Health Factor ($HF$) falls below 1.0:
$$HF = \frac{\sum (Collateral_i \times LiquidationThreshold_i)}{\sum Borrowed_j}$$
Once $HF < 1.0$, third-party liquidators are economically incentivized to repay a portion of the borrower's debt in exchange for seized collateral awarded at a discount, commonly known as the liquidation bonus (typically 5 to 10 percent).
However, during market flash crashes, network congestion and gas fee spikes can disrupt timely liquidations. If market prices decline faster than liquidators can execute transactions, loans accumulate bad debt, which the protocol treasury or safety module must absorb.
Furthermore, liquidation transactions are intensely targeted by Maximal Extractable Value (MEV) searchers. Research from Flashbots reveals that searchers compete in priority gas auctions or direct builder bundles to backrun price oracle updates and frontrun competing liquidator transactions. Analysts evaluate mempool dynamics, block builder concentration, and liquidation latency to determine whether protocol parameters are resilient against liquidation failures during extreme market stress.
Institutional risk desks, including venture teams at Galaxy Digital and Framework Ventures, run agent-based simulations to test how liquidation curves perform under historical liquidity drawdowns like the March 2020 crash or the FTX collapse. Derivative derivatives data from Coinglass, on-chain entity flows from Glassnode, and sentiment indicators from Santiment are incorporated into multi-factor solvency dashboards.
The primary technical skill required of any DeFi analyst is writing performant SQL to query blockchain event logs. Blockchains write data sequentially into raw block tables. Analytics platforms like Dune Analytics parse and decode these hex logs into human-readable relational schemas.
Consider this example query analyzing the 30-day volume and fee generation of a decentralized lending pool:
WITH daily_borrows AS (
    SELECT
        DATE_TRUNC('day', evt_block_time) AS block_date,
        SUM(borrowAmount / 1e6) AS total_borrowed_usd,
        COUNT(DISTINCT borrower) AS unique_borrowers
    FROM aave_v3_ethereum.Pool_evt_Borrow
    WHERE reserve = 0xA0b86991c6218b36c1d19D4a2e9Eb0cE3606eB48 -- USDC
      AND evt_block_time >= NOW() - INTERVAL '30' DAY
    GROUP BY 1
),
daily_repayments AS (
    SELECT
        DATE_TRUNC('day', evt_block_time) AS block_date,
        SUM(repushedAmount / 1e6) AS total_repaid_usd
    FROM aave_v3_ethereum.Pool_evt_Repay
    WHERE reserve = 0xA0b86991c6218b36c1d19D4a2e9Eb0cE3606eB48
      AND evt_block_time >= NOW() - INTERVAL '30' DAY
    GROUP BY 1
)
SELECT
    b.block_date,
    b.total_borrowed_usd,
    COALESCE(r.total_repaid_usd, 0) AS total_repaid_usd,
    (b.total_borrowed_usd - COALESCE(r.total_repaid_usd, 0)) AS net_borrow_flow,
    b.unique_borrowers
FROM daily_borrows b
LEFT JOIN daily_repayments r ON b.block_date = r.block_date
ORDER BY b.block_date DESC;
A proficient analyst checks query outputs against official block explorers like Etherscan or protocol subgraphs to avoid counting failed transactions, mismatched decimals, or internal proxy calls.
In addition to SQL, analysts track institutional fund movements and smart money wallet clusters using behavioral intelligence tools like Nansen and Arkham Intelligence.
DeFi analytics extends beyond valuation into defensive security analysis. Even a protocol with pristine unit economics can collapse if its smart contracts possess economic design flaws.
Flash Loan Attack Vulnerabilities: Flash loans allow an actor to borrow millions in capital without collateral, provided the loan is repaid within the same execution block. If a protocol calculates collateral values using spot prices from a single decentralized AMM pool, an attacker can manipulate that pool with a flash loan, borrow unbacked assets from the lending protocol, and exit before the block concludes. Analysts ensure protocols utilize decentralized oracle feeds from Chainlink Documentation or Pyth Network, backed by robust time-weighted average prices.
Governance Attack Vectors: Many protocols govern system parameters through token voting. If the market value of voting tokens needed to pass a governance proposal is lower than the liquid value in the protocol treasury, malicious actors can borrow governance tokens, pass a malicious transfer proposal, and drain the treasury. Analysts audit governance timelocks, quorum requirements, and multisig threshold signers.
Cross-Chain Bridge Risk: Bridging protocols hold immense liquidity pools locked on one network while minting wrapped representations on another. Analysts evaluate bridge verification mechanisms, cross-chain messaging validation, and Layer 2 settlement assumptions tracked on L2Beat.
Firms study audit reports from reputable security firms like Trail of Bits and OpenZeppelin, tracking competitive audit submissions on Code4rena and Sherlock to identify recurring vulnerability patterns.
The demand for talented DeFi analysts remains strong as institutional capital enters on-chain markets. According to recruitment reports from Web3.career and industry compensation reviews from Pantera Capital:
Entry-level DeFi analysts with strong SQL skills, a verified portfolio of public Dune dashboards, and clear writing abilities typically secure starting salaries between $80,000 and $115,000 USD. Mid-level analysts with 2 to 3 years of crypto-native experience, proficiency in Python statistical modeling, and track records covering multiple protocol sectors command between $120,000 and $170,000 USD. Senior research analysts, token economists, and head of research leads at prominent funds earn from $175,000 to $250,000 USD in base pay, frequently augmented with fund carry or protocol token allocations.
To stand out in the hiring process, candidates should focus on creating proof of competence:
Build Public Dune Dashboards: Create and maintain public, well-documented dashboards tracking complex protocols, focusing on net flows, borrower health factors, and fee distributions.
Publish In-Depth Research Memos: Write long-form, thesis-driven protocol teardowns on Substack or Mirror, breaking down protocol revenue mechanics, competitive moats, and risk vectors, similar to publications from Bankless or Delphi Digital.
Participate in Governance Forums: Contribute constructive risk analyses and parameter recommendations to governance forums on Aave, Sky, or Uniswap.
Demonstrate Adversarial Acumen: Analyze post-mortem reports of DeFi exploits, documenting exactly why the economic mechanism failed and how future designs can prevent similar failures.
By mastering on-chain SQL, understanding financial risk modeling, and maintaining an objective, data-backed approach to protocol economics, aspiring analysts can build fulfilling careers helping direct the allocation of billions of dollars across the decentralized financial ecosystem.